Let's say that you are using Google and you want to find some information about how to fix your kitchen sink when the garbage disposal stops working. You might go to www.google.com and type "fix garbage disposal in sink" into the search field. When I did this I got this


Each result in this table is like another result in the ranked list that Google returns when you do a search. We'll use this data to explain precision and recall
Precision
Think of precision as answering the question, "how many of the results that I got are actually relevant?" This question is answered as a percent. So in the example above, we say that we have 4 relevant results out of 10, or 40% (0.4). When it comes to search algorithm performance, a standard rule of thumb is to just use the first 10 results to measure this. We'll be using this throughout this blog post.
Recall
Think of recall as answering the question, "How many of all of the relevant results did the search show me?" I haven't told you how many total relevant results there are for the example above yet though so we need more information. Let's say that in the whole database (could be the web), there were actually only 5 relevant documents (webpages, whatever,...). Once we know that we would be able to say that the recall in this example was 4 out of 5, or 80% (0.8).
Which one to use?
So would you rather use precision or recall? Think about it. Which question are you trying to answer? Do you want all of the results to be relevant, or do you want to make sure you return as many of the relevant results as possible? They're both desirable, but a little different.
For most Google searches I perform, precision seems to be more important because I really only need to find 1 or 2 websites that answer my question; having 100 websites that answer my question doesn't add much value.
If we're trying to do an exhaustive search for all of the documents that cover a certain topic (e.g. a patent search, or information search for a PhD dissertation), then recall seems to be what we care about.
In most applications there is a desirable balance between precision and recall. The easiest way to calculate a balance would be to just take the average. What happens when we do this? In the example above we would get 0.60 which seems to make sense. What if we have a different example where there are 2 relevant documents, but the results look like this

In this case the precision is 2/10, or 0.2. The recall is 2/2, or 1.0. If we take the simple average of precision and recall, we get 0.6 again. This doesn't make sense because even though the precision was much worse, the recall of 100% balanced it out. What we really want (instead of using a simple mean) is a way to get an average that is only high when both are high, and can get low when either precision or recall get low. One special way of doing this is called F1. The F1 formula looks like this

This formula is pretty handy. Since precision and recall are always going to be values between 0 and 1, the numerator will always be between 0 and 2 (2 times 0, or 2 times 1). The denominator will also always be between 0 and 2 (0+0, or 1+1). The numerator will also always be smaller than the denominator; this gives us F1 values that are always between 0 and 1. I want to show you some examples so you get a feeling for how this works. The table below shows a wide array of F1 values based on different values of precision and recall

I used some conditional formatting in Excel to make this table a little more visual. Red values are lower and green values higher. You can see that there is strong preference for instances when both precision and recall are high, and a penalty when either one of them is too low.
F-Measure (general)
As mentioned above there may be times when you want your search engine to favour precision over recall, or vice versa. To deal with this problem there is a general form of the F1 formula that allows the user to adjust a value, Beta (β), in order to give more weight to precision or recall. This general form looks like this

If you set beta equal to 1, then you'll find that this formula simplifies to the F1 formula I already showed you earlier. It may not be intuitive for people out there how you should change the value of beta to favour precision or recall, so I thought that I would create a small chart that would give you some examples of how the F value changes with different values of beta.

First thing you need to notice is that the horizontal axis on this chart is in a logarithmic scale. This should help you understand that if you really want to change the way the F-score favours precision or recall you need to think orders of magnitude, not small changes. I created the red and blue lines in the chart to show that switching the values of precision and recall doesn't create symmetric lines. That's OK though because when you use an F score, you're really only trying to figure out if the results are better than another; relative comparison.
Let's use this F-score chart to think through a theoretical example. Say that the chart above represents the results from one query for 4 different versions of a search engine I created. If that were true, I could then use the chart above to estimate a value of beta that seems to match the way I want the results to come out. Suppose that I think that the results from the purple version of the search engine are the best for what I'm looking for, then the green one, then the blue one, then the red one. In that scenario, I would need to pick a value of beta somewhere between 0.4 and 1 (remember it's a log scale so that cross-over point between the blue and green line is difficult to estimate visually).
Average Precision
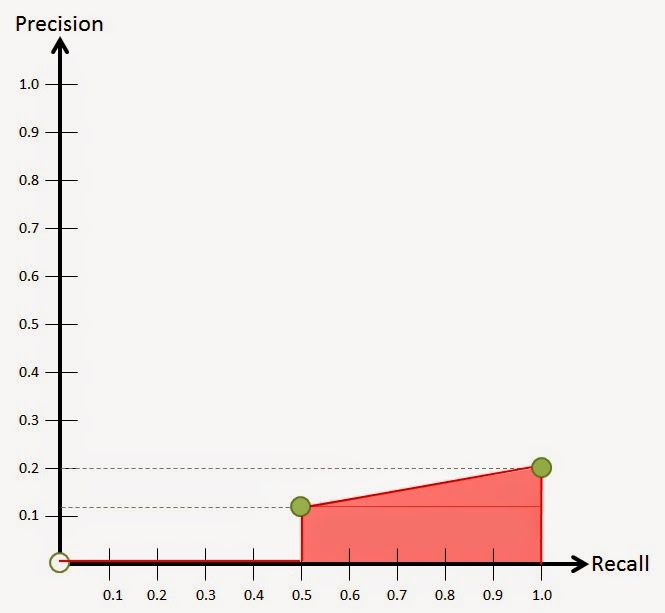
Another way to try to combine the effects of precision and recall is Average Precision. To visualize this approach we'll plot what is called the precision recall curve. To create this curve, we have to figure out what the precision and recall is as you progressively work down the results from the query. If we do this for the 2 examples I used at the beginning of this post you'll get something like this.

It's important to see that the precision is calculated as you go. So for the first line in the first example, the precision is 1, because it's the first result and it's relevant. The second line has a precision of 0.5 because we still have the relevant result from the first line, but the 2nd one isn't relevant and we've only looked at 2 results (1/2). When you construct a precision recall curve, you only care about the points where you find a relevant result (green dots below). The curves for the 2 examples above look like this.

These are the methods and variants of calculating precision and recall that I learned from professor ChengXiang Zhai's "Text Retrieval and Search Engines" Coursera course. There are other ways of measuring the effectiveness of a search algorithm that were presented in that course as well. Perhaps I'll write a post about that some other time in the future.
As always, I hope this helped somebody out there understand these topics more clearly.!
No comments:
Post a Comment