When analyzing patterns in data, what we are really looking for are patterns that are interesting. There are subjective ways to determine if data is interesting, but data analysis can be sped up significantly by creating objective measures for "interesting". When looking for patterns, associations and correlations in data, many algorithms will use the objective measures of support and confidence. These concepts are easier to understand looking at an example.
Example: Suppose we have happen to have a small sample of the transaction records from a grocery store. The transactions might look something like this:

A quick glance at this table shows that there seems to be a pattern of buying milk at the same time bread is bought, but let's figure out what the support and confidence for this is. The support for a pattern between milk and bread are the instances where they show up together in a transaction.
Basically this is the equivalent of an AND logic statement. So, for our example above the support for Milk U Bread would be 3. In larger datasets, it makes more sense to divide this number by the total number of transactions so we can get a feeling for what percentage of transactions have these items together. If we did that the support would be 60%. Support does not have to be just for 2 items, we can figure out support for 1 item alone (support for Salsa = 1, or 20%) or for several items together (support for Flour, Milk and Bread = 1,or 20%)
Confidence is defined as P(Y|X). If it's been a couple years since you were in a statistics class, that probably when over you head, but that's OK...don't be afraid. In math speak P(Y|X) means "probability of Y given X". In English it means, if you already know that you have something, say milk = X, in your transaction, then what's the probability that you also have something else, say bread = Y? So if you have milk...

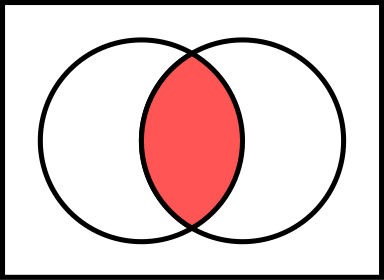
What percentage of the transactions that have milk have bread also?

So to calculate the Confidence that if you have milk, you have bread too, just take the support for milk and bread (we counted 3 above) and divide it by the support for milk (it's 4 in our list). That gives a confidence of 75%. The mathematical notation for this association is Milk --> Bread (60%, 75%). The 60% is the support for the pair pattern, and the 75% is the confidence. Notice that this calculation can be done both ways. What if I know I have bread and want to know the confidence I have of there being milk also? The support for the combination of the two items is still 3, but the support for bread on its own is also 3. That means the confidence is 100% based on our data. So Bread --> Milk (60%, 100%). It's obvious from the numerical results that the Venn diagrams I drew above are definitely NOT to scale, but it makes it easier to visualize the difference between the different items and their intersection.
No comments:
Post a Comment